In today’s data-driven world, organizations are continually seeking ways to extract meaningful insights from their vast datasets. The evolution of business intelligence tools has played a pivotal role in this journey, and at the forefront of this transformation is Microsoft Power BI. This article delves into the process of Power BI Consulting Services transitioning from raw data to insightful dashboards using the robust capabilities of Power BI.
I. Introduction to Power BI
Power BI is a powerful business analytics tool developed by Microsoft that empowers users to visualize and share insights across an organization. It seamlessly integrates with a variety of data sources, allowing users to connect, transform, and visualize data in a way that is both intuitive and impactful.
II. Connecting to Data Sources
The journey begins with connecting Power BI to diverse data sources. Whether it’s an Excel spreadsheet, a SQL database, or cloud-based services like Azure and SharePoint, Power BI provides connectors that facilitate smooth data integration. This ensures that decision-makers have access to the most up-to-date information at their fingertips.
III. Data Transformation and Modeling
Once connected, the next step is transforming raw data into a format that facilitates meaningful analysis. Power BI’s Power Query Editor enables users to clean, reshape, and combine data from multiple sources. Additionally, the data modeling capabilities of Power BI allow for the creation of relationships between different datasets, laying the foundation for comprehensive and holistic insights.
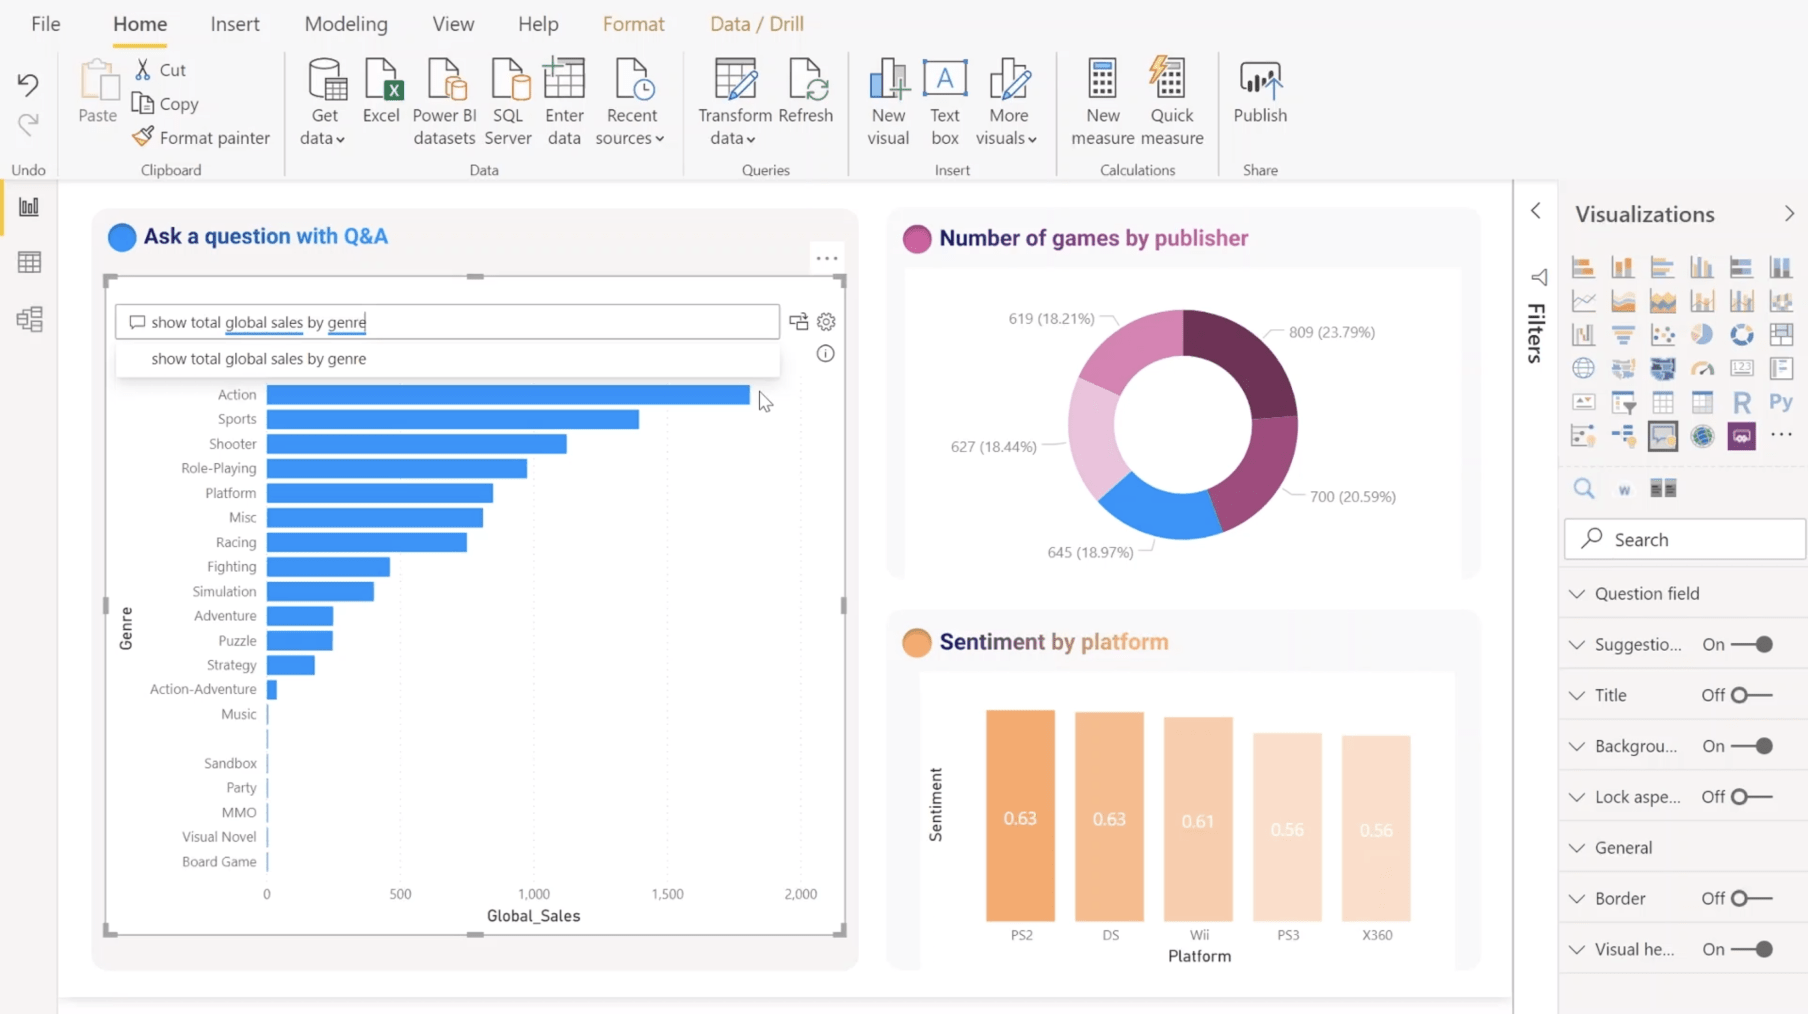
IV. Creating Compelling Visualizations
The heart of Power BI lies in its ability to convert complex datasets into visually compelling and easy-to-understand dashboards. Users can choose from a rich library of pre-built visualizations or customize their own to suit specific business requirements. Whether it’s bar charts, line graphs, or heatmaps, Power BI offers a diverse range of visualization options.
V. Advanced Analytics with DAX
Power BI’s Data Analysis Expressions (DAX) language takes analysis to the next level. DAX allows users to create custom calculations, aggregations, and business metrics that go beyond basic reporting. This capability is especially valuable for organizations that require sophisticated analytical insights tailored to their unique needs.
VI. Real-time Analytics and Dashboards
In today’s fast-paced business environment, real-time insights are crucial. Power BI allows users to create dashboards that update in real-time, ensuring that decision-makers always have access to the latest information. This feature is particularly beneficial for monitoring key performance indicators (KPIs) and responding swiftly to changes in the business landscape.
VII. Collaboration and Sharing
Power BI isn’t just a tool for individual analysis—it’s a platform for collaboration. Users can share their reports and dashboards securely within the organization or with external stakeholders. The integration with Microsoft 365 enables seamless collaboration, with features like co-authoring and commenting, fostering a culture of shared insights.
VIII. Mobile Accessibility
In an era where mobility is paramount, Power BI extends its reach beyond desktops. The mobile app allows users to access reports and dashboards from anywhere, ensuring that decision-makers are not tied to their desks. This accessibility is a game-changer, enabling on-the-go decision-making and collaboration.
IX. Governance and Security
With great power comes great responsibility. Power BI prioritizes governance and security, providing administrators with the tools to manage access, monitor usage, and ensure compliance with organizational policies. This ensures that sensitive information is handled with care and that data-driven decisions are made within a secure framework.
X. Continuous Learning and Community Support
As technology evolves, continuous learning is essential. Power BI offers a plethora of resources, including documentation, tutorials, and a vibrant online community. Users can leverage these resources to stay abreast of the latest features, best practices, and innovative use cases, fostering a culture of perpetual improvement.
XI. Conclusion
In conclusion, the journey from raw data to insightful dashboards is made seamless and powerful with Microsoft Power BI. Its versatility, ease of use, and integration capabilities make it a preferred choice for organizations seeking to harness the full potential of their data. By embracing Power BI, businesses can transform their analysis processes, drive informed decision-making, and stay ahead in an increasingly competitive landscape.